
Biostatistics Formulas
Part 1: The formulas
Part 2: Explanation of the formulas
Formulas & Tables
| Disease + | Disease – | |||
| Test + | true positive (TP) a | False negative (FN) b | a+b | PPV = a/(a+b) |
| Test – | False positive (FP) c | True negative (TN) d | c+d | NPV = d/(c+d) |
| a+c | b+d | total | ||
| SN = a/(a+c) | SP = d/(b+d) |
| For Diagnostic tests | Formula |
| Sensitivity, SN (true-positive rate) | = TP/ (TP +FN) which is a/(a+c) |
| Specificity, SP (true-negative rate) | = TN/ (TN + FP) which is d/(b+d) |
| Positive predictive value (PPV) | = TP / (TP + FP), which is a/(a+b) |
| Negative predictive value (NPV) | = TN / (TN + FN), which is d/(c+d) |
| Incidence rate | = # of new cases / population at risk. *for a specific time period |
| Prevalence | = # of existing cases ( / population at risk. *for current period of time |
| Accuracy | = (TP+TN)/total. The probability of correctly identifying someone as TN or TP. |
4×4 Contingency table
| Event + | Event – | ||
| Exposed or treatment group | a | b | a+b |
| Unexposed or control group | c | d | c+d |
| a+c | b+d | total |
| For Quantifying Risk & Therapeutic Efficacy | Formula |
| Odds ratio (OR) | ad/ bc |
| Relative risk (RR) | [a/(a+b)] / [c/(c+d)] i.e. treatment or exposed event rate/ control or unexposed event rate |
| Relative risk reduction (RRR) | 1 – RR. ARR/ control rate |
| Absolute risk (AR) | [a/(a+b)] – [c/(c+d)] |
| Absolute risk reduction (ARR) | control rate – treatment rate |
| Absolute risk increase (ARI) | treatment rate – control rate |
| Absolute risk percent (ARP) | (RR-1)/RR. Also = (ARI/treatment rate) x 100 |
| Number needed to treat (NNT) | 1/ ARR |
| Number needed to harm (NNH) | 1/ ARI |
Explanation of Formulas
Sensitivity
The quality of a diagnostic test can be determined by its sensitivity and specificity.
Sensitivity tells us how well a test identifies people with the disease. A highly sensitive test makes a great screening tool because it will detect most of the affected individuals in a population. The sensitivity of a test can also be referred to as the true positive rate.
SN = TP/ (TP +FN).
Specificity
Specificity tells us how well a test identifies people without the disease. A highly specific test will more effectively rule out those who don’t have a particular disease. The specificity of a test can also be referred to as the true negative rate.
SP = TN/ (TN + FP)
Prevalence
Prevalence is the amount of people in the population who are disease positive over the total population.
Prevalence (P) & Predictive value
PPV = positive predictive value, NPV = negative predictive value
↑P = ↑PPV and ↓NPV
↓P = ↓PPV and ↑NPV
The quality of the relationship between a particular exposure and an outcome can be determined by looking at the relative risk and the odds ratio. These two measures are used in evaluating case-control studies and cohort studies.

Odds ratio
The Odds ratio tells us the odds of an outcome (e.g. disease) occurring in the exposed group compared to it occurring in the non-exposed group. The odds ratio is typically used to evaluate case control studies. Note: ossa od disease in the exposed group = a/b, meaning exposed with disease (a) divided by exposed without disease. Odds of disease in the non-exposed group = c/d. We do this, because odds is the comparison of an outcome occurring vs. it not occurring.
OR = (a/b) / (c/d) = (ad)/(bc)
Relative Risk
The Relative risk tells us risk of an outcome (e.g. disease) in the exposed group compared to non-exposed group. The relative risk is typically used to evaluate cohort studies. Note: risk in of disease in the exposed group = a/(a+b), meaning those exposed with the disease divided by all those who were exposed. Risk in the non-exposed group is c/(c+d). We do this, because risk is the chance the outcome of interest will occur compared to the chance of all possible outcomes occurring.
RR = [a/(a+b)] / [c/(c+d)]
The odds ratio may approximate the relative risk
It is possible for the relative risk to approach the odds ratio i.e. RR ~ OR.
RR = [a/(a+b)] / [c/(c+d)] = (a/b) / (c/d) = ad/bc = OR. If a << b and c << d.
This occurs when a disease is rare i.e. when there is low prevalence of disease.
What does the relative risk mean?
RR = 1 means that there is no relationship between the exposure and the outcome (e.g. disease).
RR > 1 means that there is a positive relationship between the exposure and the outcome (e.g. disease). This means that the exposure is associated with an increased risk of disease.
RR < 1 means that there is a negative relationship between the exposure and the outcome. In this case, the exposure is associated with a decreased risk of disease.
Test Cut-off values
Changing the cut-off value needed for a test to be positive, HbA1c >6.5 is positive, will change many measures (TN, TP, SN, SP, PPV, NPV). Many questions of boards will ask which direction theses measures will change based on whether the cut-off is lowered or increased.
Higher cut-off leads to increased SP, TN, and NPV i.e. all the “negatives” because a higher cut-off will result in more people without disease testing positive. Where as lower cut-off leads to increased SN, TP, and PPV i.e. all the “positives”, because a lower cut-off value will result in more of the positive test results being due to those who really do have disease.
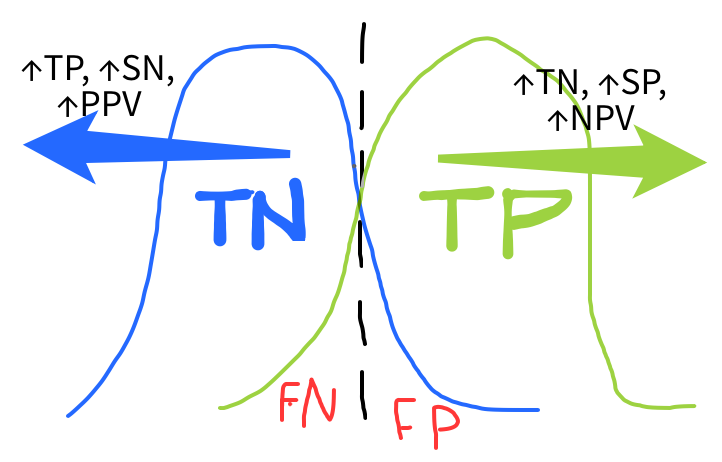
For example, if the blood pressure cut-off to diagnose hypertension is reduced to 120/80 then we will catch everyone with hypertension, i.e. increase TP, PPV and SN. However, we will have many more false positives, so higher TN, SP and NPV.
| Disease + | Disease – | |||
| Test + | true positive (TP) a | False negative (FN) b | a+b | PPV = a/(a+b) |
| Test – | False positive (FP) c | True negative (TN) d | c+d | NPV = d/(c+d) |
| a+c | b+d | total | ||
| SN = a/(a+c) | SP = d/(b+d) |
Using the table, if a is increased i.e. more positive tests because the cut-off for a positive test is lowered, then ↑TP (=a) and ↑PPV (= a/(a+b)) and ↑SN (=a/(a+c)).
Similarly, if the cut-off value needed for a positive test is increased, then less a and more d. So, ↑TN (=d) and ↑NPV (=d/(c+d)) and ↑SP (=d/(b+d).
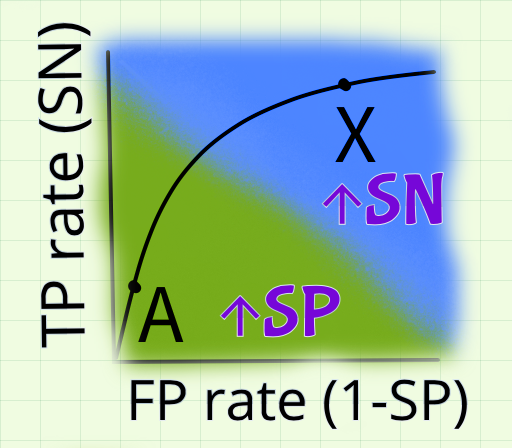
Receiver operative curve (ROC)
This curve shows how test SN and SP change with changing cut-off values. Here, X is a low cut-off approaching 0%, and A is the higher cut-off which approaches 100%. Specificity (SP) is highest at A, and Sensitivity (SN) is highest at X.
You May Also Like
